Training & nutrition
My average day outside of work is very health-focused. Studying nutrition and exercise helped me build a routine that optimizes my health, and I am regularly at the gym.
Portfolio
Early-career clinical researcher in cardiology & cardio-oncology
Three years of research at a cardiac-MRI company: preparing data, running analyses, creating visualizations used for published findings.
Open to clinical research roles · US/MENA/EU
Sample dashboard
A cardio-oncology surveillance view of the kind my analyses feed into: a simulated cohort of 480 patients on cancer therapy, scored by a strain-based risk model. Every number here is synthetic. Click anywhere on it to see the analyses behind it.
Simulated data generated for this portfolio. No patient information is shown; the model and cohort are illustrations of the methods, not study results.
About
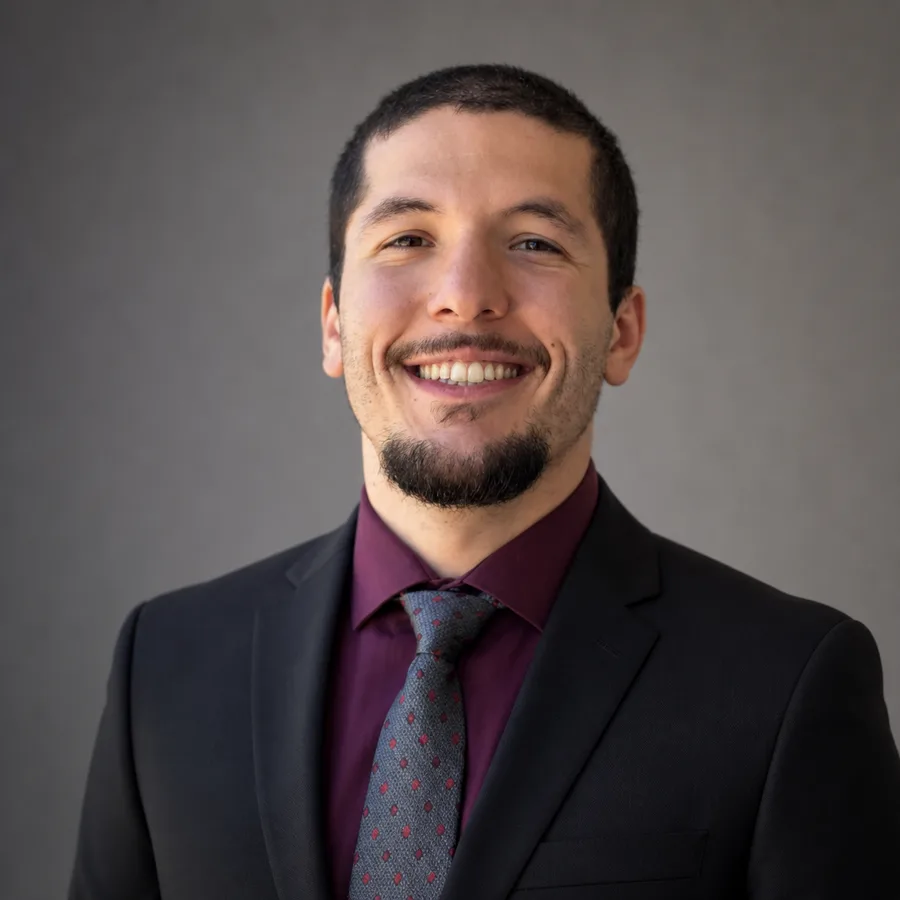
I’m 26, currently living in Cary, North Carolina, and early in my career in clinical research. I graduated summa cum laude from NC State with a B.S. in Human Biology, then spent over three years at MyoCardial Solutions, a cardiac-MRI company, working on research in cardiology and cardio-oncology.
Most of that time was spent handling clinical data: cardiac MRI, biomarkers, ECG, exercise testing, and medication records from heart-failure, congenital, transplant, and cancer-treatment cohorts. Working closely with clinicians, cardiologists, researchers, and business teams at a startup, I learned how to turn a clinical question into an analysis plan, how to create meaningful results, and how to explain it clearly to those who will use it.
A large part of my work focused on patients treated for cancer. I developed and validated timing metrics from heart-muscle strain that help flag cardiac injury from chemotherapy early, with precision comparable to or even exceeding standard measures, which is the trend I want to continue pursuing.
About / Beyond the work
Music, travel, the everyday routines that keep me balanced, and a game I made. This is the part of me that does not fit on a résumé.

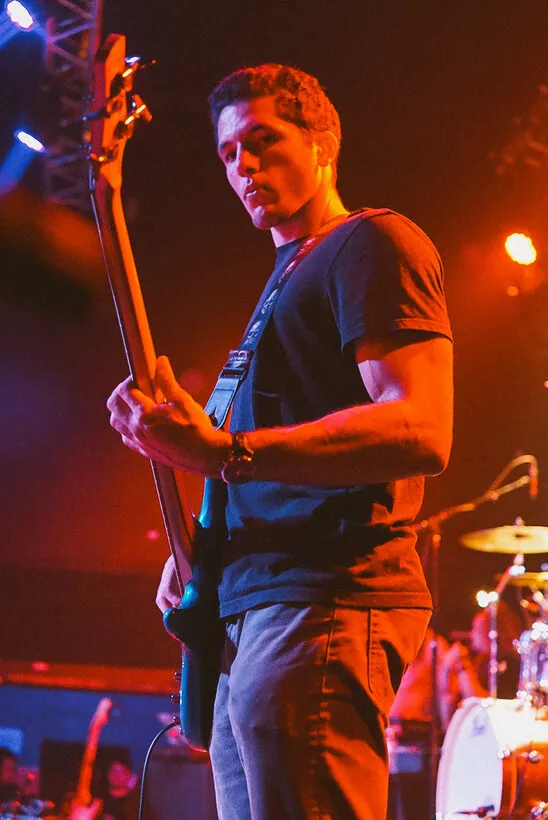
Bassist · since the summer of 2021
Alternative Latin funk & reggae, sung in Spanish
Stan y Denghy pairs an “old-school” taste in music with inspiration from across the globe. The band was started by friends of mine who immigrated from Venezuela as teens, and with bandmates from such diverse backgrounds we also draw on African, Arabic, and American music. The result is a blend of cultures with a vintage feel that people can dance to while they reminisce.
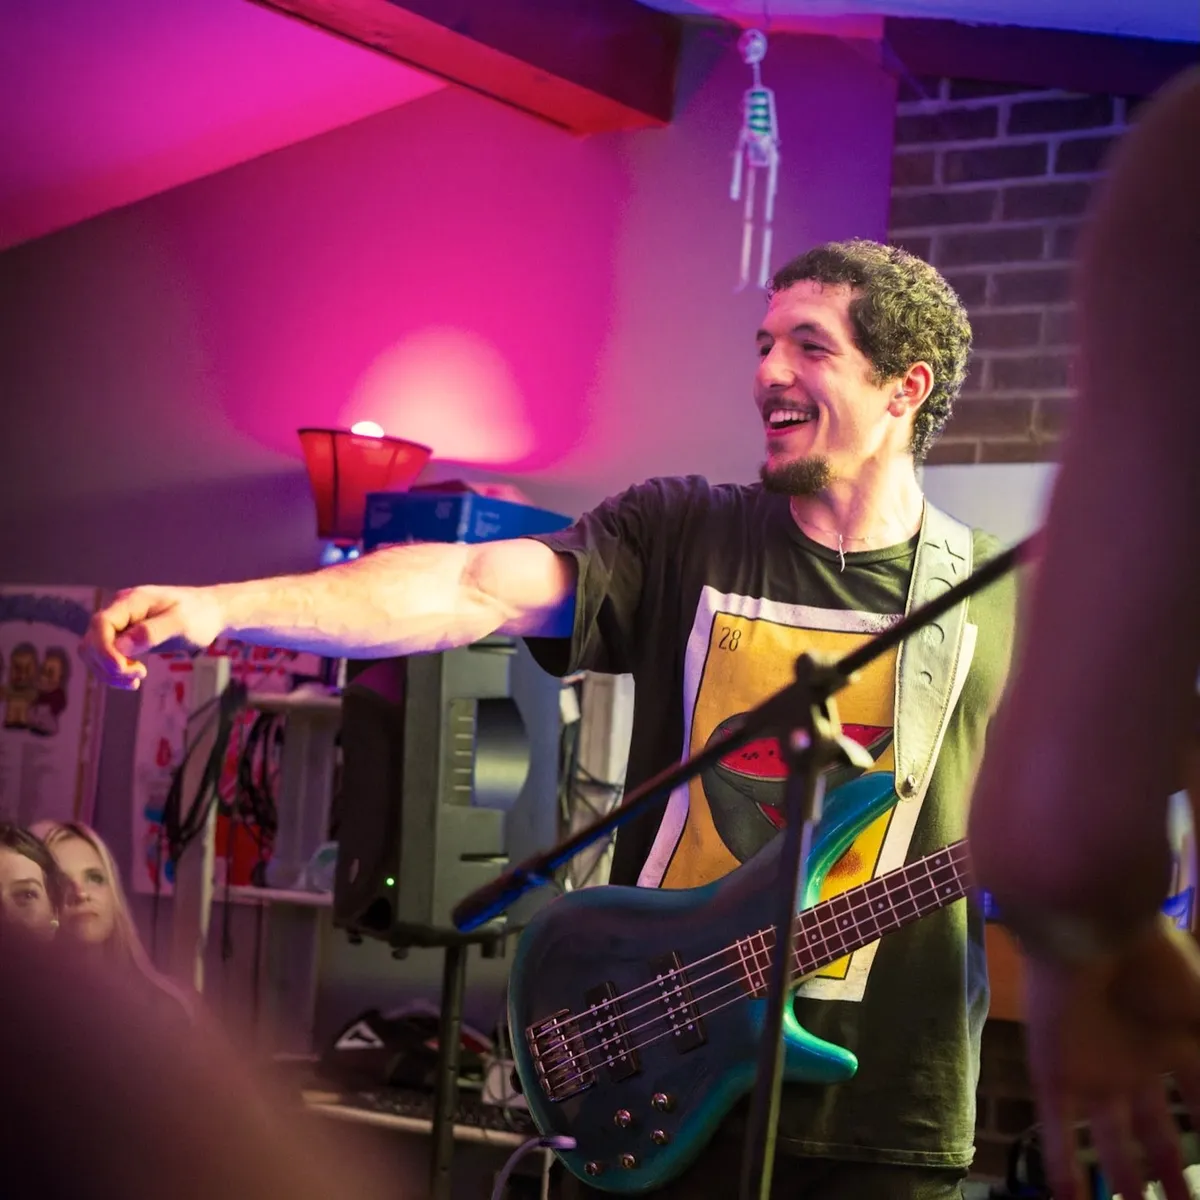
I picked up the bass in the summer of 2021, and it quickly turned into a deep passion. Before long I was touring the East Coast with my band, Stan y Denghy, and we released an album together.
I have also played bass for artists including lesthegenius, KATA, Finesse the Phantom, and Cherri May, recorded on a number of released tracks, and helped put together shows for fundraisers. It has always been purely a hobby, and my favorite part is being able to focus on a craft and perform it for others.
A lot of hard work made this happen, but anything is possible when you love what you do.
On the road
Also on bass for
Lately I have put music on the back burner to focus on my career, but I still practice to keep my mind sharp.
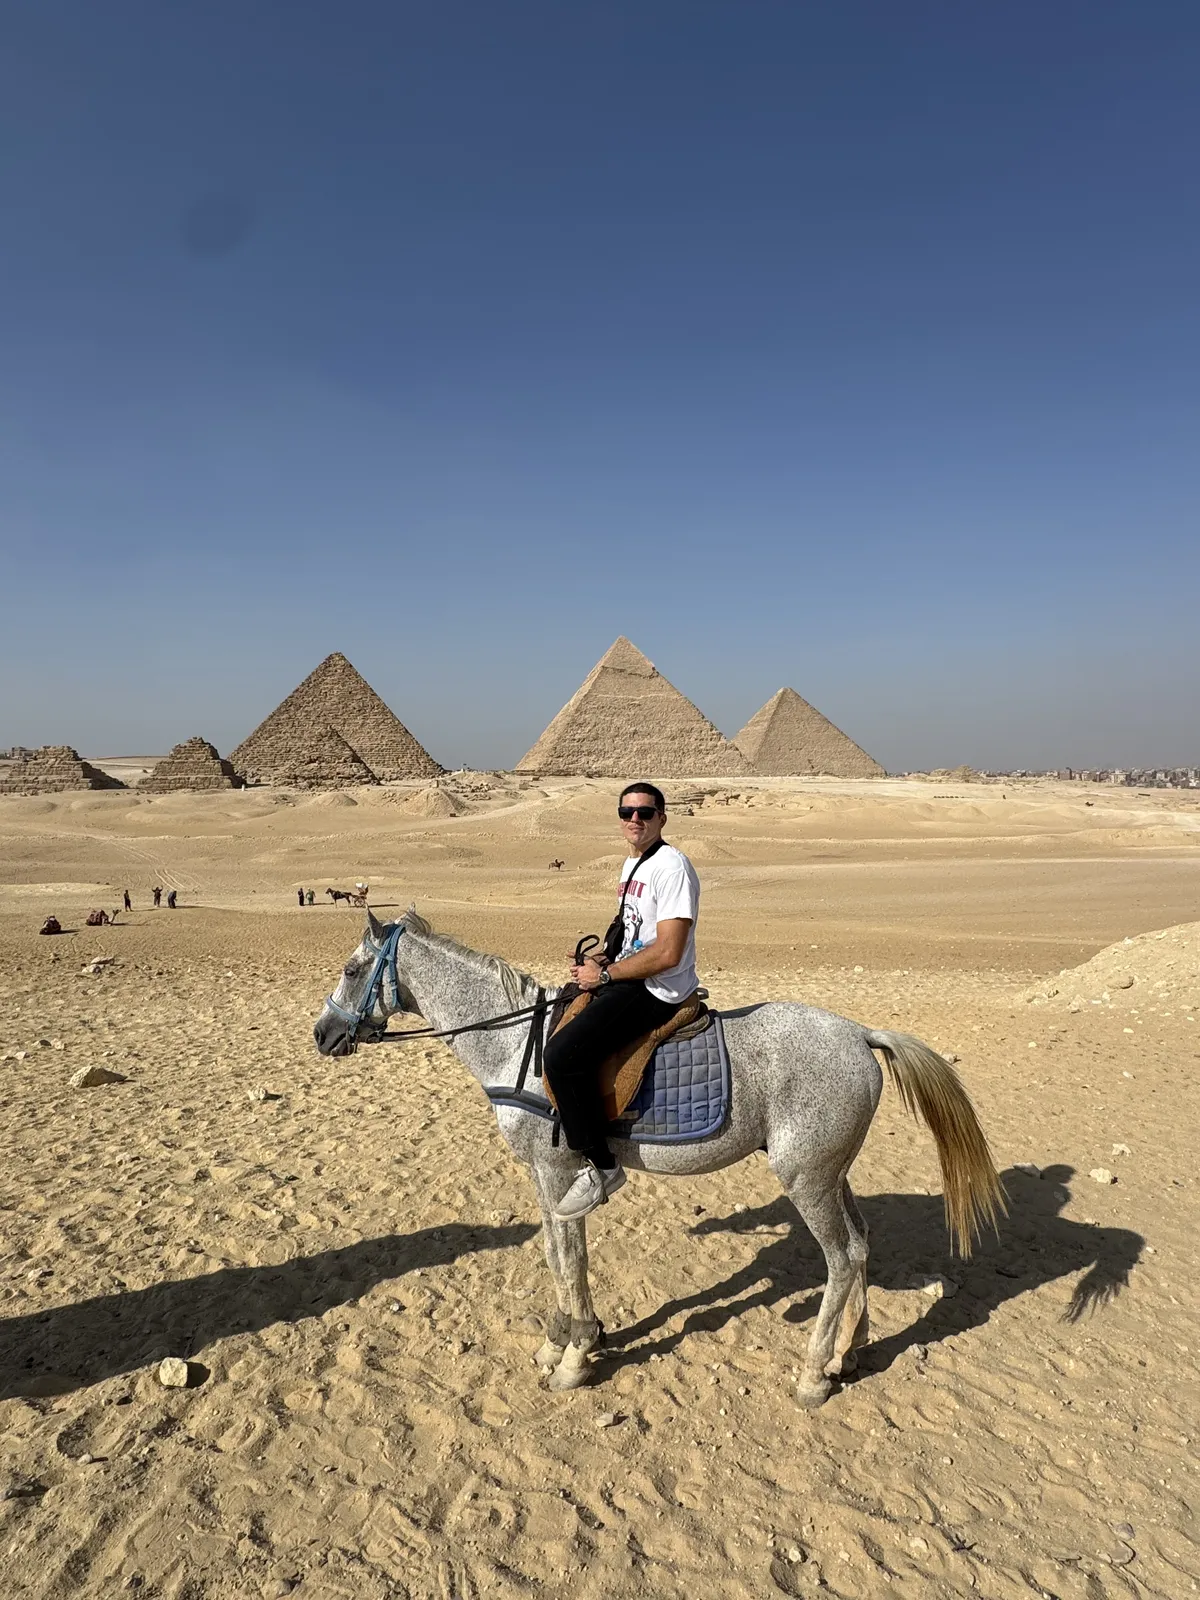
Traveling has been a passion of mine for decades. Growing up, I traveled to Egypt to visit family, and I lived there for two years, between the ages of seven and ten.
My favorite part of traveling is seeing historical monuments and experiencing new cultures. Walking around a city, meeting people, and trying new foods are all part of it, but my love for history and culture is core to who I am. Learning about people’s backgrounds gives a much wider perspective on the human experience and the different walks of life across our world.
15countries outside the US, and counting
The Americas
Europe
Where continents meet
North Africa
“Learning about people’s backgrounds gives a much wider perspective on the human experience.”
Outside of music and travel, my days are built around health and curiosity.
My average day outside of work is very health-focused. Studying nutrition and exercise helped me build a routine that optimizes my health, and I am regularly at the gym.
I play regularly, mostly soccer (fútbol) and basketball.
When I am relaxing, I read books or watch documentaries on history and anthropology, and I stay up to date with technology and world events. I enjoy knowing a little about a lot.
English (fluent) and Egyptian Arabic (conversational).
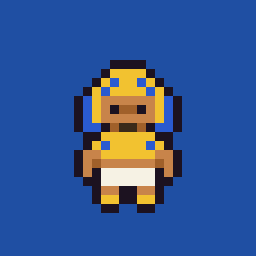
Creator · released October 2026
A pixel-art arcade game about crossing the street in Egypt
There is no crosswalk and the traffic never stops, so you do what every Egyptian does: step into the road, raise your hand, and trust the drivers (mostly). You weave between microbuses, tuk-tuks, and wedding processions across Cairo, Giza, and Alex, and a well-aimed shibshib (house slipper) stops a speeding car.
I made it as a side project, building it with Claude, Anthropic’s AI assistant. It is now on the App Store, and the Android version is in testing on Google Play.
Also on masryroad.com
Experience
Three-plus years of cardiology and cardio-oncology research at a cardiac-MRI company, built on earlier lab and clinic work.
What I bring to a team.
Where I am still improving, and how I handle it.
Without new challenges, my focus can drift.
How I handle itI break long, repetitive work into milestones and automate the routine parts where I can.
My project ideas can outgrow the time and scope available.
How I handle itI define a minimum version first and expand only once it works.
I am drawn to new approaches, sometimes when a proven method already works.
How I handle itI check whether the established method already does the job before building something new.
MyoCardial Solutions, Inc. · Morrisville, NC · Full-time
Aug 2022 – Dec 2025Most relevant
Levitate · Raleigh, NC
Feb – Jun 2026
Michael Reiskind Lab, NC State · Raleigh, NC · Part-time
Oct 2021 – Aug 2022
Family Medical Associates of Raleigh · Part-time
Oct 2020 – Aug 2022
Anthracycline and radiation exposure, clinical and subclinical cardiotoxicity, cardiorecovery, and cardiac surveillance in childhood cancer survivors.
Heart-failure phenotypes and staging (HFpEF, HFmrEF, HFrEF, NYHA class, AHA stage), the Charlson Comorbidity Index, and measures from LVEF, volumes, and stroke volume to T1/T2, QRS and ST intervals, and VO2 max.
F-SENC strain analysis, DICOM work across Siemens and Philips CMR, LGE review for infarcts, AHA 17-segment polar maps, 3D heart models from 2D slices (MevisLab), and 0.55T versus 1.5T comparisons.
Diagnostic accuracy (ROC and AUC, precision-recall, sensitivity, specificity, F1), Kaplan-Meier survival with hazard ratios and forest plots, Bland-Altman agreement, logistic regression, ANOVA, chi-square, and nonparametric tests.
Python (pandas, NumPy, SciPy, statsmodels, Matplotlib), MySQL, DICOM curation and bulk scan processing, automated tables and figures, and AI-assisted workflows for research and reporting.
Verification and validation of production algorithms, algorithm QA, bulk script validation, and seven-language interface testing for FDA-regulated software releases.
Education
B.S., Human Biology · Jan 2019 – May 2022
Featured research
Chemotherapy can quietly injure the heart, and ejection fraction, the standard measure, often drops only after the damage is done. At MyoCardial Solutions I developed and validated three metrics that read the shape and timing of cardiac strain curves to surface that injury sooner. They are implemented in production software and were included as supplemental analyses in the PREFECT cardiotoxicity study.
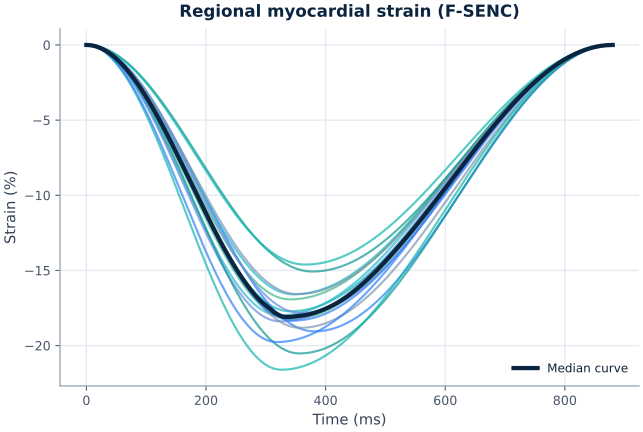
Every F-SENC scan produces a temporal strain curve for each myocardial segment. I built a reproducible pipeline that smooths the raw curves with a Gaussian-process method (validated against the Savitzky-Golay filter), rejects non-physiologic curves, and computes three complementary measures of myocardial timing and coordination.
The three metrics
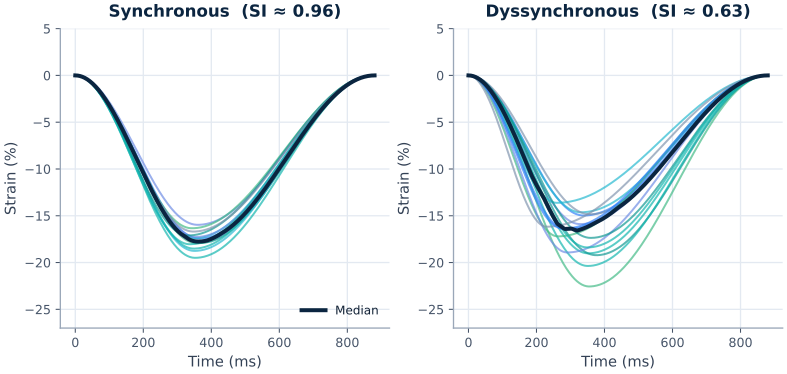
SI is a Spearman correlation of every regional strain curve against the heart’s median curve. A value near 1.0 means the whole ventricle contracts and relaxes together; lower values reveal mechanical dyssynchrony.
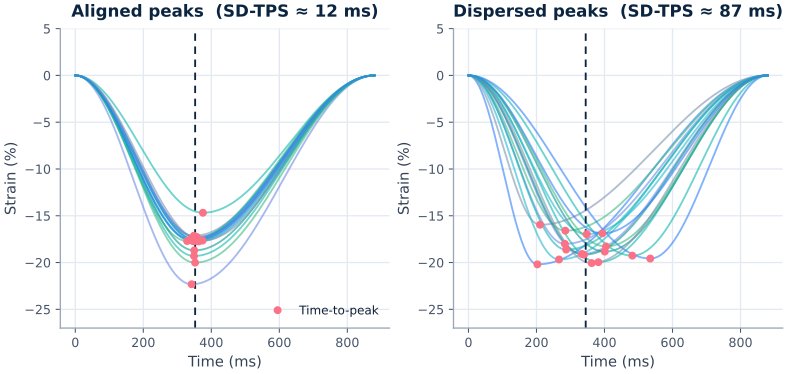
SD-TPS measures the variability in time from the ECG R-wave to peak systolic strain across all segments. Tightly aligned peaks (under 50 ms) indicate synchronized contraction; a wide spread (over 100 ms) flags discoordination.
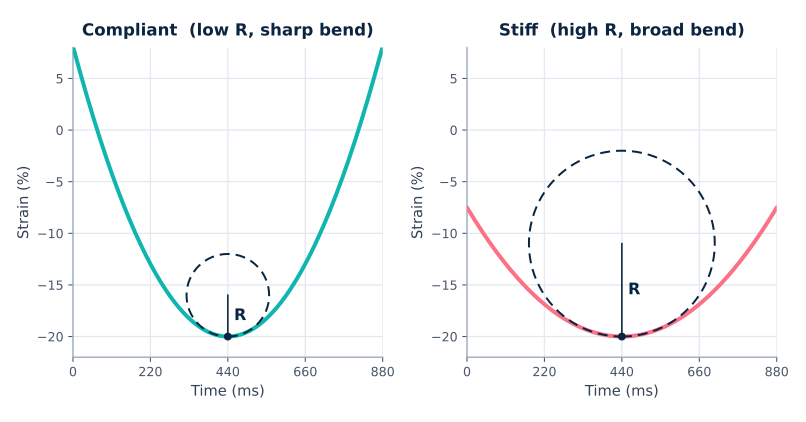
R quantifies the sharpness of the systole-to-diastole bend of the strain curve, normalized to the R-R interval so it is dimensionless and heart-rate independent. A sharp bend (low R) reflects a compliant myocardium; a broad bend (high R) suggests stiffness.
Lenihan D, Whayne J, Osman F, et al. Myocardial strain measurements obtained with fast-strain-encoded cardiac magnetic resonance for the risk prediction and early detection of chemotherapy-related cardiotoxicity compared to left ventricular ejection fraction. Diagnostics. 2025;15(15):1948.
Impact: F-SENC strain, including these timing metrics, identified patients at risk for chemotherapy-related cardiotoxicity and detected subclinical dysfunction with higher sensitivity than LVEF, supporting earlier cardio-oncology risk stratification and monitoring.
Read the paper (DOI)Figures are original, simulated illustrations of the published methods; they do not display patient data or any confidential material.
Publications
Papers and conference abstracts I co-authored in cardiac MRI, ordered by my authorship contribution, with my name in bold. Much of this work is in cardio-oncology: chemotherapy-related cardiotoxicity and cardiac surveillance in childhood cancer survivors.
Showed F-SENC CMR can identify patients at risk for chemotherapy-related cardiotoxicity and detect subclinical dysfunction with higher sensitivity than LVEF, improving early cardio-oncology risk stratification.
View publication (DOI)Evaluated novel fSENC-derived temporal strain parameters for detecting myocardial dyssynchrony in congenital heart disease, enabling more detailed assessment of abnormal myocardial mechanics.
Search for this paperFound abnormal myocardial strain despite preserved LVEF in pediatric heart-transplant recipients, supporting SENC-CMR as a more sensitive tool for transplant surveillance.
Search for this paperDemonstrated the feasibility of fastSENC CMR for identifying subclinical myocardial dysfunction in pediatric cardio-oncology patients exposed to cardiotoxic therapy, supporting detection beyond ejection fraction.
Search for this paperSupported validation of SENC-derived segmental strain on a wide-bore 0.55T platform, broadening access to strain imaging for patients who benefit from low-field or wider-bore CMR.
View publication (DOI)Evaluated SENC-CMR for detecting subclinical cardiotoxicity in childhood cancer survivors, supporting strain imaging as a more sensitive method than conventional functional measures for early surveillance.
View publication (DOI)Showed strain abnormalities detectable in Duchenne muscular dystrophy despite preserved ejection fraction, supporting SENC-CMR for earlier cardiomyopathy assessment.
Search for this paperDemonstrated SENC imaging is feasible at 0.55T with good agreement for global strain versus 1.5T, supporting low-field CMR as a pathway to more accessible cardiac strain imaging.
View publication (DOI)Explored whether cardiorespiratory fitness and a structured aerobic program influence cardiotoxicity risk and myocardial strain in anthracycline-exposed survivors.
View publication (DOI)Preprint evaluating exercise, cardiorespiratory fitness, and myocardial strain in anthracycline-exposed childhood cancer survivors.
View preprint (DOI)Ordered by authorship seniority; the Diagnostics article is my most senior peer-reviewed authorship. Acknowledgments credit analysis and figure work, and the medRxiv preprint is an earlier version of the Cardio-Oncology paper.
Figures and tables from the published work. Click one to enlarge it, or open the paper it comes from.
Figure 4 · Diagnostics, 2025
Lenihan et al., PREFECT study
Read the paperFigure 1 · Diagnostics, 2025
Lenihan et al., PREFECT study
Read the paperFigure 6 · Cardio-Oncology, 2025
Toro-Salazar et al., pilot exercise intervention
Read the paperFigure 1 · SCMR 2026 · JCMR 28(S1)
Lee et al., pediatric heart-transplant recipients
Read the paperFigure 2 · SCMR 2026 · JCMR 28(S1)
Lee et al., pediatric heart-transplant recipients
Read the paperTable 1 · JCMR 2024 · 26(S1)
Heyniger et al., segmental strain at 0.55T
Read the paperReproduced from the published, open-access papers with attribution; each links to its source.
Analyses
The methods I used in research and what each one tells a clinician, the pipelines I built, and a plotting tool I made along the way. Figures use simulated data for illustration only and do not represent real patients or study results.
Click a figure to see what it shows and how I used it. All figures use simulated data.
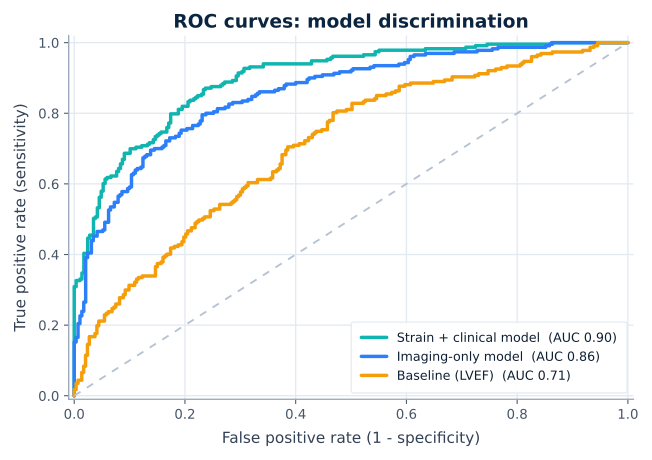
Comparing diagnostic models by area under the curve.
Logistic regression · ROC / AUC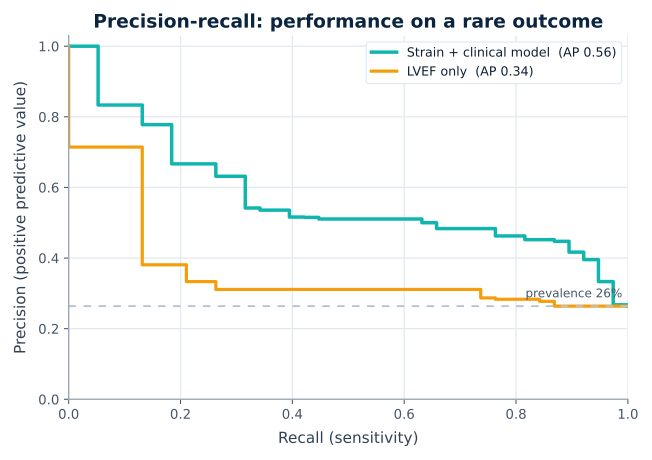
How well a model finds a less common outcome, beyond what AUC shows.
Machine learning · PR / AP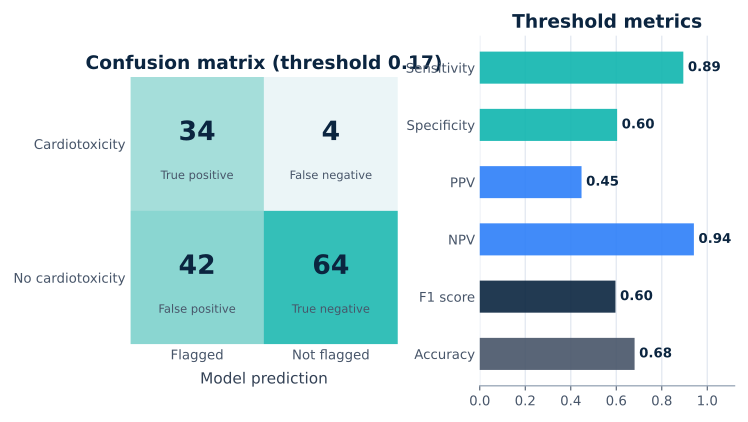
Sensitivity, specificity, PPV, NPV, F1, and accuracy at a chosen cutoff.
Machine learning · Classification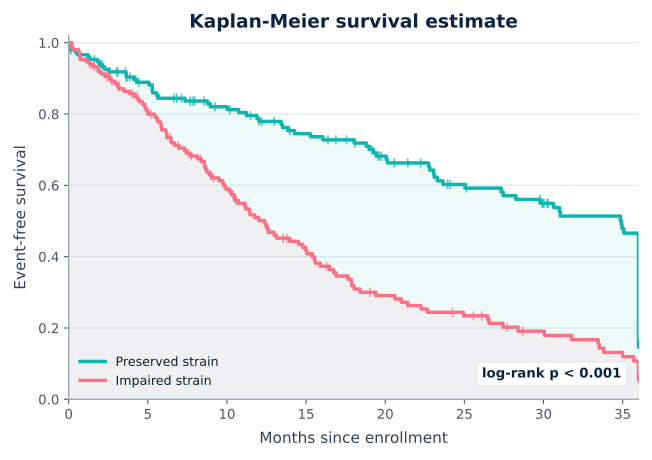
Time-to-event between two strata, with a log-rank test.
Survival · Log-rank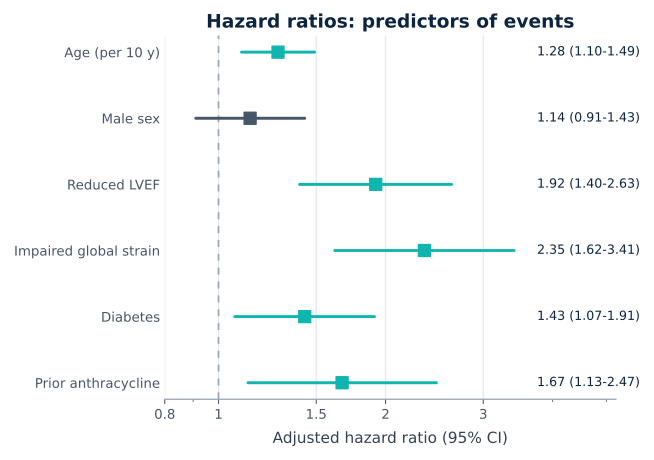
Adjusted hazard ratios with 95% confidence intervals.
Survival · Hazard ratios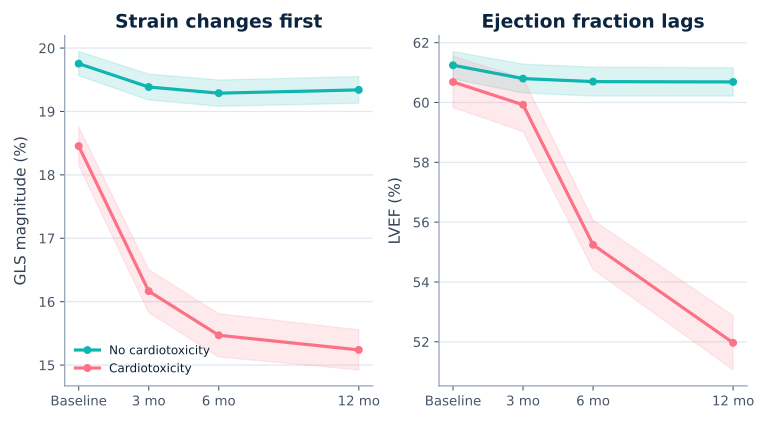
Strain and ejection fraction across follow-up visits, with 95% CIs.
Longitudinal · Repeated measures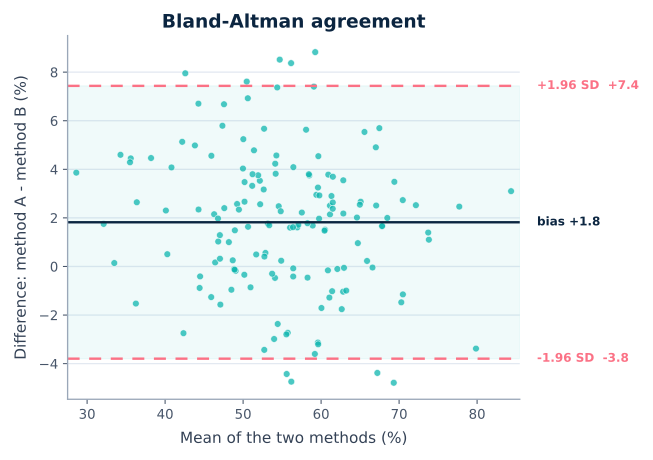
Bias and limits of agreement between two methods.
Method validation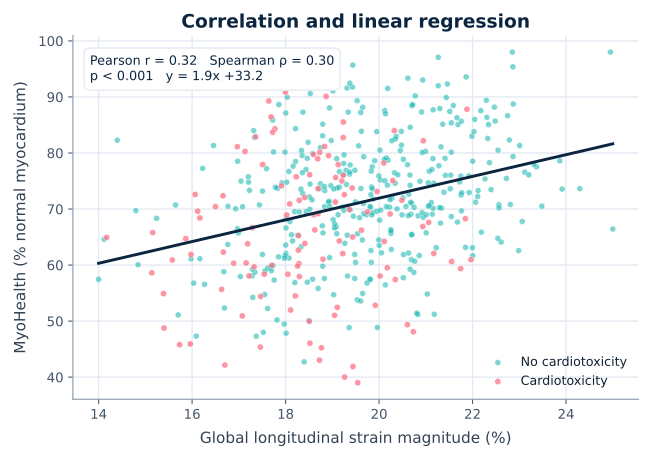
Strength and direction of a relationship, with Pearson and Spearman.
Association · Regression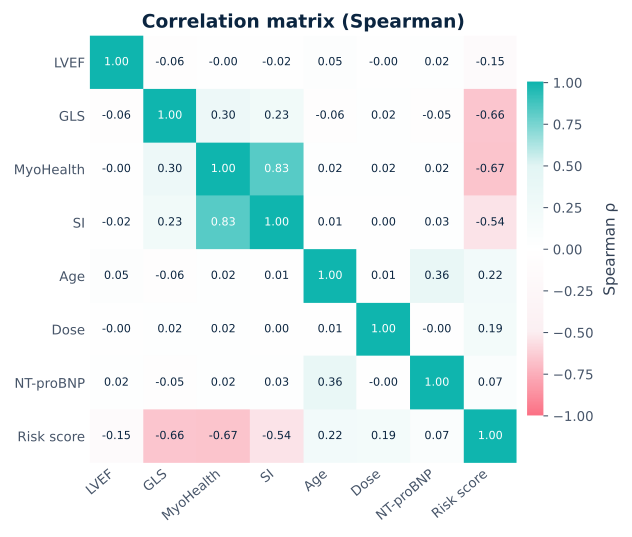
How imaging, clinical, and risk variables move together.
Association · Heat map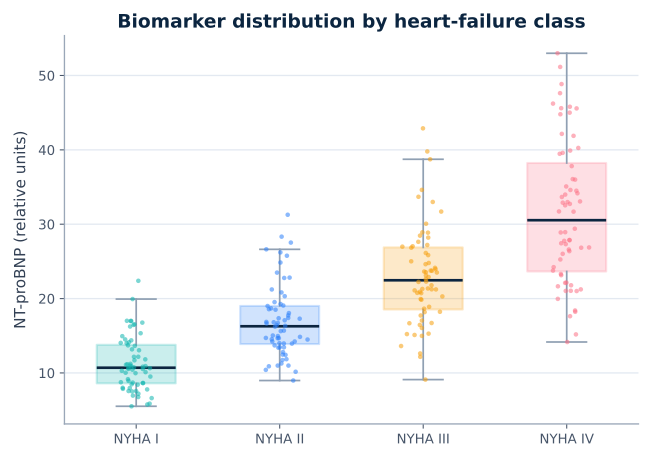
Distributions across clinical groups with raw data shown.
Group comparison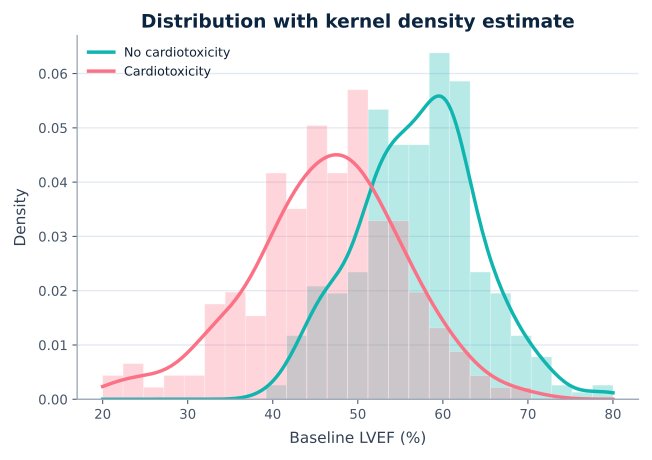
Distribution of a measure across outcome groups.
Exploratory analysis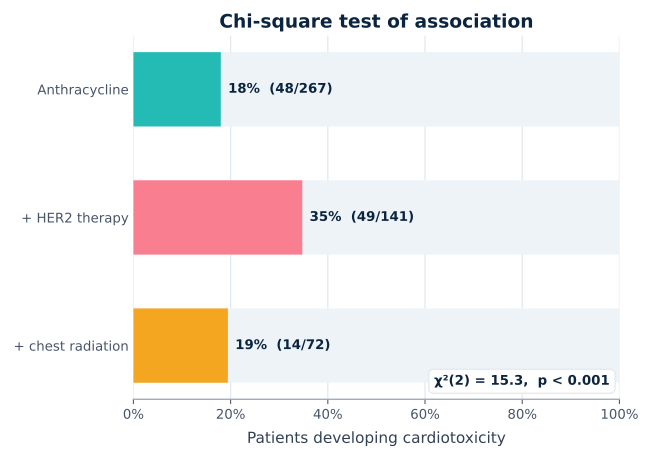
Cardiotoxicity rates compared across treatment regimens.
Group comparison · χ²End-to-end pipelines I designed and built. Click one to explore it.
Side project
A browser tool I built for quickly visualizing and comparing analyses.
Load a CSV or Excel sheet and build figures: scatter plots with regression, grouped box plots, ROC and precision-recall curves, Kaplan-Meier survival curves, stacked histograms, chi-square association, and Table 1 summaries, then restyle them live and arrange them on a dashboard. A separate strain panel animates myocardial strain the way I learned to read it: a 17-segment AHA polar-map movie, a strain-curve heartbeat, and a smoothing demo, all on built-in synthetic data.
Testimonials
Recommendations from people I’ve worked with, in their own words, shared with their permission.
Farouk joined Myocardial Solutions Inc. as a Clinical Data Scientist and quickly became one of the people I relied on most, reporting to me directly while owning end-to-end analysis for more than seven cardiology and cardio-oncology studies.1,2 His technical range is rare for someone early in their career: he built reproducible Python pipelines for everything from ROC/AUC and survival analysis to Bland-Altman agreement testing, developed and verified novel timing-based myocardial function metrics that were implemented in commercial software, and provided key validation to support FDA-clearance. I was impressed as to how effectively he paired that rigor with modern AI-assisted workflows to accelerate research, reporting, and analysis while maintaining accuracy and clinical applicability. Beyond the analytics, Farouk communicates complex findings clearly to clinicians and non-technical stakeholders, builds trust, and brings a curiosity and work ethic that make him a strong fit for any team in clinical data research or a client-facing medical role, and I recommend him without reservation.
I had the pleasure of working closely with Farouk Osman on the MyoStrain application, where we collaborated on retrieving clinical cases from studies and validating critical timing metrics of Myocardium. Farouk consistently demonstrated a level of dedication that went beyond what was expected — he would dig into edge cases and inconsistencies until every metric was thoroughly verified. His problem-solving instinct was one of his standout qualities; whenever we hit a roadblock in data validation, Farouk was the first to propose a practical path forward. He is the kind of teammate who elevates the quality of the entire project simply by being involved, and I would recommend him without hesitation.
I would love to add your perspective. Reviews come straight to me, and I confirm with you before anything is published.
What’s next
Three years in cardiology and cardio-oncology research showed me where I want to grow. Oncology is moving quickly, with new therapies and diagnostics reaching patients all the time, and each one needs careful evidence behind it on both efficacy and safety. These are the areas I want to learn next.
Cancer-treatment cohorts are where much of my research already sat: anthracycline and radiation exposure, childhood cancer survivors, and treatment-related heart risk. I want to go further into oncology trials and outcomes, where the endpoints are response, progression, and survival.
I have worked to regulated standards, validating algorithms and testing releases of FDA-regulated cardiac software. I want to learn how that works in oncology, where evidence requirements and approval pathways shape what reaches patients.
Clinical records are messy, and making them answer a research question is a skill of its own. I built a pre-screening pipeline over synthetic EMR-style records and want to work with real-world oncology data next.
Cancer care is increasingly defined at the molecular level, with biomarker-defined subgroups and targeted therapy. My human-biology background is a starting point, and the genetic components of oncology are an area I am actively exploring.
The first three build on work I have done. The last is a direction I am deliberately building toward rather than experience I already have.
Cardio-oncology sits between cancer care and cardiology. Treatments such as anthracyclines, HER2-targeted therapy, and chest radiation can damage the heart, so researchers measure whether that is happening, how early it can be detected, and which patients are most at risk. My part in that work was preparing clinical and imaging data, running the analyses, and helping turn the results into findings clinicians and reviewers could use.
Cardiotoxicity is heart injury caused by cancer treatment. It matters because survival from cancer keeps improving, so the heart effects of treatment increasingly shape long-term outcomes. The traditional measure, left ventricular ejection fraction, often drops once meaningful damage has occurred. Strain imaging and related biomarkers can reveal dysfunction earlier, which is what my published work in the PREFECT study and in childhood cancer survivors examined.
Cardiac MRI and DICOM imaging, biomarkers, ECG, cardiopulmonary exercise testing, medication records, and patient outcomes, from more than 3,000 patients across heart-failure, cardiotoxicity, congenital, transplant, ischemia, and PVC cohorts. I also built a pre-screening pipeline that reads synthetic EMR-style records to find patients eligible for clinical trials.
Diagnostic accuracy (ROC and AUC, sensitivity, specificity, precision-recall), Kaplan-Meier survival analysis with hazard ratios and forest plots, Bland-Altman agreement for validating a new measurement against an established one, logistic regression, ANOVA, chi-square, and parametric and nonparametric group comparisons, mostly in Python with MySQL.
At MyoCardial Solutions I validated production algorithms, ran algorithm QA and bulk script validation, and tested the software interface in seven languages to support release readiness for FDA-regulated cardiac imaging software. I also wrote statistical analysis plans and prepared manuscript-ready analyses and figures. Growing that regulatory experience in oncology is one of my goals.
I am based in Cary, North Carolina, near Raleigh, Durham, and Research Triangle Park, and I am open to relocation and to remote work. I am looking for early-career roles in clinical research, especially in oncology and cardiology, where I can keep working with clinical data and learn new skills to help further my career. The contact page reaches me directly.
Contact
If you’re hiring for a clinical research role or want to talk about my work, send a note or ask me to call. I usually reply within one business day.
Share a few details and I will reply by email.
Prefer to talk? Leave your number and a good time, and I will call you. Your details are never shared.
Cary, North Carolina · open to relocation & remote
Figure uses simulated data for illustration only.
Beyond the standard analyses, I built custom and exploratory visualizations for many kinds of research data, from cardiac imaging to biomarkers and outcomes, each designed to be easy to interpret and matched to its audience and research question.
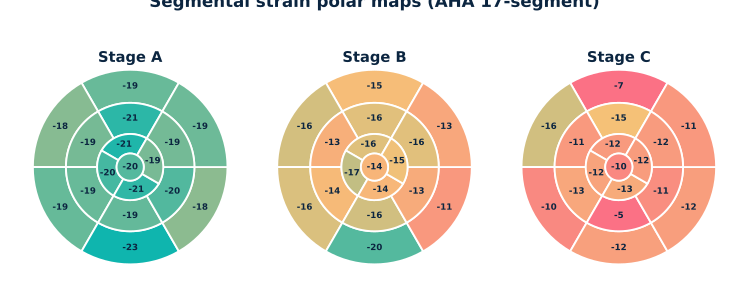
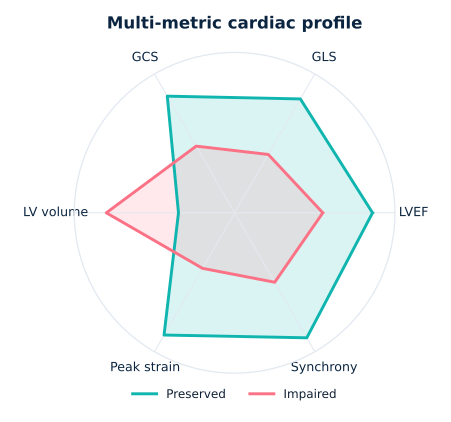
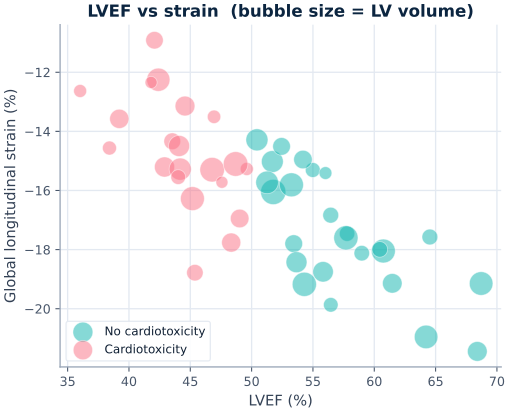
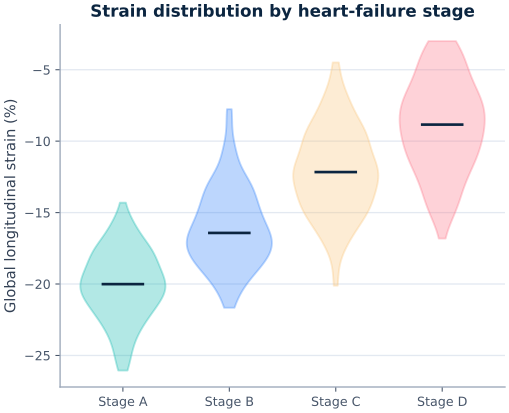
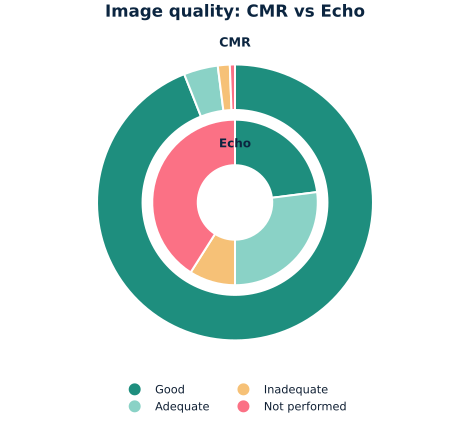
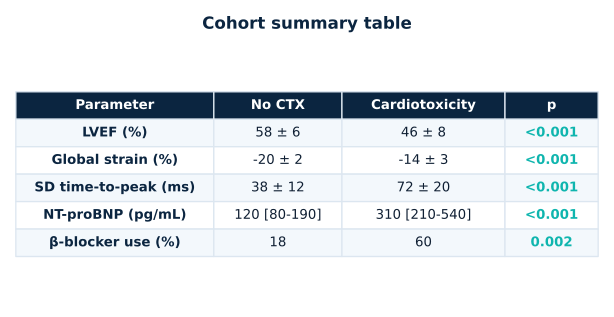
Figures use simulated data for illustration only.
An end-to-end, reproducible pipeline that reviews electronic health records to identify, rank, and validate patients for a portfolio of real clinical trials across therapeutic areas. It mirrors the daily work of a clinical data specialist on a research site network: read charts, interpret each protocol, pre-screen every patient against every trial, rank the shortlist, and document every decision to an auditable standard.
Anti-inflammatory (colchicine) therapy in acute decompensated HFrEF
LY4268989 in moderately-to-severely active ulcerative colitis
Semaglutide (GLP-1 RA) for weight loss in non-diabetic obese adults
Criteria were retrieved verbatim from the ClinicalTrials.gov API and encoded as versioned data. Adding a fourth trial is a single new module.
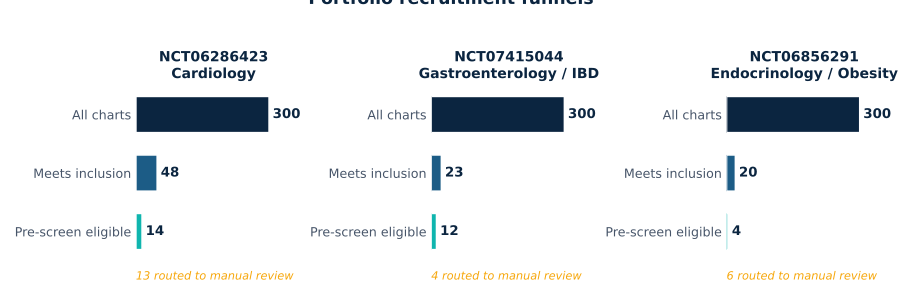
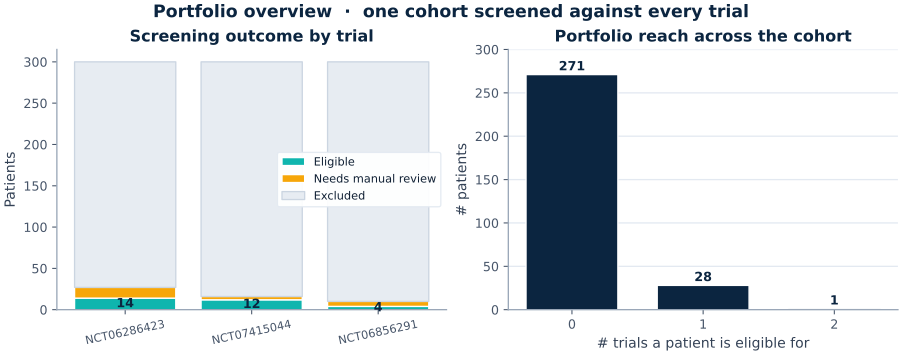
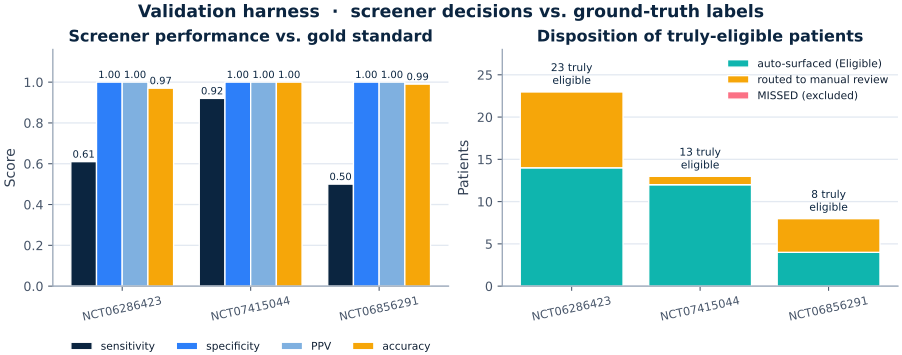
Built entirely on 100% synthetic EHR data (Synthea-style). No real patients and no PHI. A portfolio demonstration, not a validated medical tool; any real deployment would confirm every automated decision with a clinician.
A batch pipeline that takes raw cardiac-MRI exams from hundreds of patients and returns validated myocardial dyssynchrony metrics with no manual steps in between. It automates the strain-analysis software to produce per-segment strain data, reads that data together with the underlying DICOM headers to reconstruct every regional strain curve, cleans the noisy signals, and then computes timing and coordination metrics directly from the curve mathematics, writing the results to structured spreadsheets ready for statistical analysis.
Nothing is clicked by hand. For every patient folder the pipeline writes and launches a batch job that runs the strain-analysis engine on the exam, watches the process until its strain-data file appears, enforces a 10-minute timeout, and automatically re-runs any case that failed to produce output, logging the stragglers so a run of hundreds of scans finishes unattended.
Each segment's strain curve is then parsed from that output. Cardiac timing is essential to the metrics, so when a file is missing frame timing the pipeline falls back to the raw DICOM headers with pydicom to recover the R-R interval, nominal interval, or heart rate, then rebuilds the time axis and maps each imaging series to its cardiac slice by its protocol name.
Raw strain curves are noisy, and reliable metrics need a clean underlying trend. Every curve is smoothed with a Gaussian-process regressor (an RBF plus white-noise kernel) and upsampled for resolution, while curves without a clear contraction-and-relaxation shape are automatically rejected. The Gaussian approach was validated against the established Savitzky-Golay filter and against controlled tests with added noise and missing time frames, confirming the smoothing is robust before any metric is trusted.
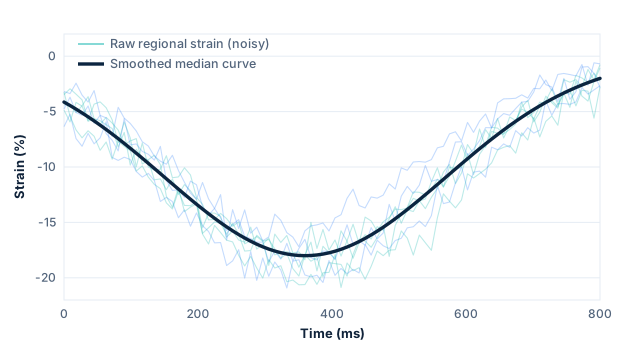
From each smoothed curve the pipeline derives three complementary measures of how the heart moves in time, the same validated timing metrics featured elsewhere on this site:
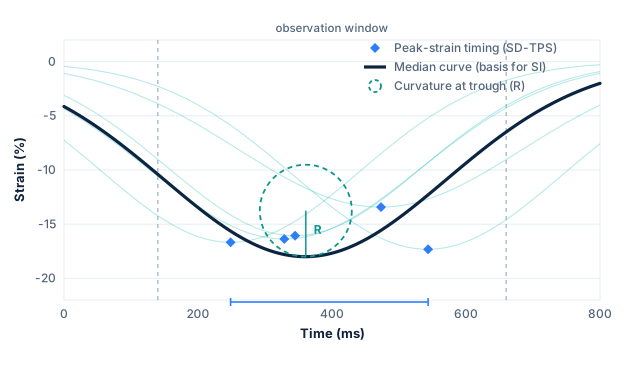
Alongside these it derives systolic and diastolic slopes, adjacent-segment agreement between neighboring regions, and threshold-based normal/functional percentages, broken out by longitudinal and circumferential views and by short- and long-axis slices.
Production pipeline developed at MyoCardial Solutions. The timing metrics it computes are implemented in released cardiac-MRI strain software and published as supplemental analyses in the PREFECT cardiotoxicity study. Figures are original, simulated illustrations of the method; no patient data or confidential material is shown.
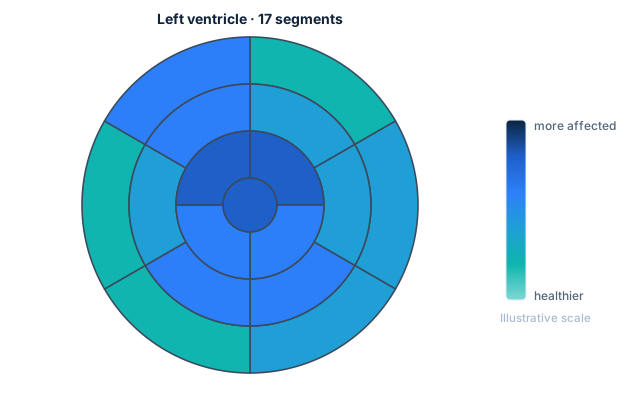
A visualization layer that turns per-segment strain metrics into the color-coded bullseye ("polar") maps clinicians read at a glance. For any patient or group it aggregates each metric onto the standard AHA myocardial segment model, maps every value through a purpose-built color scale, and renders left- and right-ventricular maps for rest, stress, and the rest-to-stress difference, so a whole cohort's regional function collapses into a single figure.
The heart is divided into the standard AHA segments, arranged as nested rings from the base of the ventricle on the outside to the apex at the center. Each segment is filled by its metric value, turning a table of numbers into a map that can be read at a glance and compared instantly across patients.
Beyond single-state maps, the tool renders paired rest and stress bullseyes and a rest-versus-stress difference map. The difference view highlights exactly which segments change under stress, the pattern that matters most for spotting inducible dysfunction.
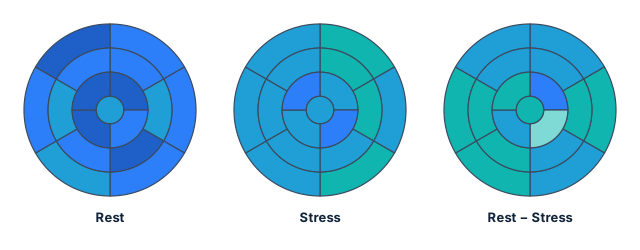
Part of the F-SENC strain analysis toolset built at MyoCardial Solutions. Figures are original, simulated illustrations of the method; no patient data or confidential material is shown.
If we have worked together, I would really value a few words about the experience. Your review is emailed directly to me, and I will confirm with you before it appears on this page.